[h=2]Introduction[/h] TDA, from Acoustics Power Labs, provides a new way of looking at the responses of speakers in rooms. Its Intuitive 3D Display of sound level vs arrival time and frequency spotlights speaker and room anomalies.
An impulse response shows energy arrival over time; TDA shows both the amplitude and the spectrum of that arriving energy over time. It is useful in both the design and fine tuning of the speakers themselves, especially their crossovers, and in integrating those speakers into rooms. TDA is the analysis step on a ladder of tools from APL that provide increasingly more powerful equalization solutions for adapting speakers to listening spaces.
TDA uses a sine sweep to obtain an impulse response that can be viewed by use of the IR and Log IR buttons on its control panel. The calculated impulse response contains non-linear distortion information that can also be displayed. Distortion can also be seen as a series of spikes before the main peak of the IR in the log IR view. Third party tool IRs can also be imported and viewed.
The obtained IR is then processed by TDA at 126 frequencies, 12 log spaced points per octave to create its unique 3D display - a 3-dimensional map of normalized sound pressure plotted with delay and frequency along the X and Y axes and SPL encoded in both color and on the Z axis. Boundary effects, room modes, timing alignment issues with multi-way speakers, and frequency response aberrations are easily recognized in this presentation. This 3D map is a very good tool for quickly evaluating a new speaker in a familiar space or a familiar speaker in a new room or position.
TDA also provides conventional frequency, delay, and phase response graphs. TDA attempts to separate the direct response from reflections based on time of arrival and succeeds in doing so down into the modal zone to an extent limited by room modes, near reflections and the increased difficulty of precisely determining the time of arrival of low frequencies. This time selectivity enables us to see both the direct response, otherwise viewable only as an anechoic or quasi-anechoic measurement, and the effect of the room. It’s not a coincidence that the human ear has the same/similar ability to separate direct sound from reflections and the same/similar limitations.
TDA’s frequency response graph, the AFR, shows this separated direct response while its 3D display allows you to judge the extent to which it stands above room and boundary effects. Where it is reflection free, it is minimum phase and thus can guide equalization; other products from APL use multiple AFRs taken at multiple positions to do just that.

Figure 1 TDA 3D Display of Soundcard Loopback Response
An ideal speaker would have a response as shown in Figure 1, the looped back response of a soundcard. A straight line along the frequency response axis representing the direct sound would indicate perfect time alignment of a multi-way speaker. The sharpness of this blade would indicate the absence of diffraction and near-in reflections. Delayed reflections would show up as lighter colors to the right of the blade in the area now dark blue. These are likely to be present in a real room measurement but not in a soundcard loopback.
In TDA, one can choose which time values to display. I’ve offset the display above by 10 ms. and limited the display range to a 30 ms. range. Unless offset, time values default to being relative to the arrival of what would be the impulse peak in a conventional IR. One has the option of connecting a reference loopback via a 2[SUP]nd[/SUP] soundcard channel if there is a need to know absolute time values – perhaps to compare sound channel latency for various configurations or FIR filters.
The Z-axis defaults to a normalized scale of 0-1 as shown here but can be set into a high dynamic range mode with a logarithmic scale and a configurable maximum value. The normalization sets the amplitude of the direct response line in the 3D display at each frequency to 1. The un-normalized direct response values appear in the AFR graph.
Just past the 25 ms. mark in this loopback response, you can see a ghostly white line parallel to the frequency axis. This was determined to be sound card internal crosstalk between its microphone preamp and line level output due to its monitor mixer circuit. I missed this ghost evaluating the sound card using conventional FR and IR measurements; had I noticed it then I would likely have a different sound card. With TDA you see things easily overlooked or misunderstood in conventional speaker measurement. [h=2]A Real Speaker at 1m[/h] A close in measurement is used when the goal is to evaluate a speaker or its crossover. Some room effects are visible in the 1m measurement shown below but the speaker does dominate. This is the response of a 3 way, full range speaker with near perfect time alignment and some crossover phase shift evident. The speaker is nestled tightly into a room corner, eliminating front and sidewall reflections but leaving it susceptible to floor and ceiling reflections that are indeed visible in the display. Some floor absorption was used near the microphone to limit the disturbance to the midrange response from the floor bounce. Except for this and some relatively thin carpet, the room is untreated. Delayed reflections from the back wall of the room are visible near the 38 ms. mark.

Figure 2 A 3-way speaker measured at 1m on axis in an untreated room
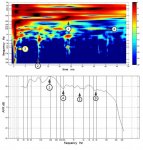
Because of the dominance of the speaker over the room modes, TDA correctly identify the direct response well down into the bass, although the direct response line does widen at lower frequencies. It’s easier to determine the frequency ranges affected by room modes and reflections by looking down on the 3D map from above. This is the TDA “pl” display option. Figure 3 The "TDA pl" display of the same measurement
It’s important to be able to distinguish between the properties of the speaker and properties of the room in these displays. To do that we must first understand the speakers; in particular, that they are corner speakers and rely on supportive reflections from nearby floor and walls to support the bass and to a lesser extent the lower midrange.
The wedge of red level response embracing the black vertical line of the direct response from 50 Hz up to 1000 Hz is the result of reflections from the floor at a nominal delay of 2.8 ms and from the ceiling as well where the delay is greater than 6.9 ms. For the corner woofer, this is floor support and does indeed seem to be propping up the direct response line in the 3D display. The crossover between the woofer and the multiple entry horn that sits on top of it is at 350 Hz and shows in the PL graph as an abrupt narrowing of the boundary support wedge. This narrowing continues gradually as frequency rises due to increasing directivity of the speaker and the increasing absorption from the carpet and temporary floor absorber used for this measurement. Unfortunately, what was boundary support for the woofer becomes boundary interference for the midrange resulting in nulls in the 400 -500 Hz range in unsmoothed measurements taken at the listening position.
Above the bass, we are seeing the speaker and not the room; that is abundantly clear in the 3D display. The color shading close in to the direct response line at higher frequencies is due to speaker imperfections and can be improved by minimum phase equalization. Strong room resonances appear as the red streaks at 50 and 70 Hz and a weaker one at 180 Hz. In a steady state, the standing waves of a room mode would develop but in a transient sine sweep or impulse response they can only be called resonances. The vertical white streak at 38 ms. has a timing consistent with a reflection from the back wall of the room.
The AFR is the un-normalized frequency response recorded along the black direct response line of the 3D display. Resonances, or their effects, can be seen in it. To wit, the resonances at 50 and 70 Hz result in a peak at 50 Hz followed by a shallow null at 70 Hz.

Figure 4 The AFR, the un-normalized frequency response graph of the direct response line of the 3D display
To the extent that the processing succeeds in separating the direct response from reflections, the effect of reflections won’t show up in the AFR. In this measurement, supportive floor reflections have elevated the bass and lower midrange but no reflection nulls are visible.
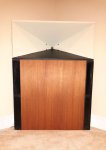
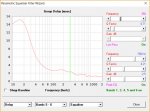
These 3 way speakers use active, DSP crossovers. They each consist of a multiple entry conical horn containing a compression driver tweeter and four 4” midranges sitting on top of a 15” sealed, slot loaded woofer nestled tightly into each of the room’s two front corners. Time alignment was achieved by setting DSP delays to align the IR peaks of individual drivers with their crossover filters and PEQs enabled. Time alignment was then confirmed with TDA. The delay bend just past the mid to CD crossover at 950 Hz is due to the mid-tweeter crossover; it increases with increasing crossover filter slope. A room resonance or reflection also affects the response there. The only hint in the 3D display of the woofer-mid crossover at 350 Hz is the narrowing of the floor support wedge there, indicating excellent time alignment. Both XOs use only 12 dB slope electrical filters, achieving 24 dB acoustical slopes. Neither crossover shows a phase wrap in its conventional frequency/phase response graph.

Figure 5 The Speaker Being Measured
[h=2](continued in next post)[/h]
An impulse response shows energy arrival over time; TDA shows both the amplitude and the spectrum of that arriving energy over time. It is useful in both the design and fine tuning of the speakers themselves, especially their crossovers, and in integrating those speakers into rooms. TDA is the analysis step on a ladder of tools from APL that provide increasingly more powerful equalization solutions for adapting speakers to listening spaces.
TDA uses a sine sweep to obtain an impulse response that can be viewed by use of the IR and Log IR buttons on its control panel. The calculated impulse response contains non-linear distortion information that can also be displayed. Distortion can also be seen as a series of spikes before the main peak of the IR in the log IR view. Third party tool IRs can also be imported and viewed.
The obtained IR is then processed by TDA at 126 frequencies, 12 log spaced points per octave to create its unique 3D display - a 3-dimensional map of normalized sound pressure plotted with delay and frequency along the X and Y axes and SPL encoded in both color and on the Z axis. Boundary effects, room modes, timing alignment issues with multi-way speakers, and frequency response aberrations are easily recognized in this presentation. This 3D map is a very good tool for quickly evaluating a new speaker in a familiar space or a familiar speaker in a new room or position.
TDA also provides conventional frequency, delay, and phase response graphs. TDA attempts to separate the direct response from reflections based on time of arrival and succeeds in doing so down into the modal zone to an extent limited by room modes, near reflections and the increased difficulty of precisely determining the time of arrival of low frequencies. This time selectivity enables us to see both the direct response, otherwise viewable only as an anechoic or quasi-anechoic measurement, and the effect of the room. It’s not a coincidence that the human ear has the same/similar ability to separate direct sound from reflections and the same/similar limitations.
TDA’s frequency response graph, the AFR, shows this separated direct response while its 3D display allows you to judge the extent to which it stands above room and boundary effects. Where it is reflection free, it is minimum phase and thus can guide equalization; other products from APL use multiple AFRs taken at multiple positions to do just that.

Figure 1 TDA 3D Display of Soundcard Loopback Response
An ideal speaker would have a response as shown in Figure 1, the looped back response of a soundcard. A straight line along the frequency response axis representing the direct sound would indicate perfect time alignment of a multi-way speaker. The sharpness of this blade would indicate the absence of diffraction and near-in reflections. Delayed reflections would show up as lighter colors to the right of the blade in the area now dark blue. These are likely to be present in a real room measurement but not in a soundcard loopback.
In TDA, one can choose which time values to display. I’ve offset the display above by 10 ms. and limited the display range to a 30 ms. range. Unless offset, time values default to being relative to the arrival of what would be the impulse peak in a conventional IR. One has the option of connecting a reference loopback via a 2[SUP]nd[/SUP] soundcard channel if there is a need to know absolute time values – perhaps to compare sound channel latency for various configurations or FIR filters.
The Z-axis defaults to a normalized scale of 0-1 as shown here but can be set into a high dynamic range mode with a logarithmic scale and a configurable maximum value. The normalization sets the amplitude of the direct response line in the 3D display at each frequency to 1. The un-normalized direct response values appear in the AFR graph.
Just past the 25 ms. mark in this loopback response, you can see a ghostly white line parallel to the frequency axis. This was determined to be sound card internal crosstalk between its microphone preamp and line level output due to its monitor mixer circuit. I missed this ghost evaluating the sound card using conventional FR and IR measurements; had I noticed it then I would likely have a different sound card. With TDA you see things easily overlooked or misunderstood in conventional speaker measurement. [h=2]A Real Speaker at 1m[/h] A close in measurement is used when the goal is to evaluate a speaker or its crossover. Some room effects are visible in the 1m measurement shown below but the speaker does dominate. This is the response of a 3 way, full range speaker with near perfect time alignment and some crossover phase shift evident. The speaker is nestled tightly into a room corner, eliminating front and sidewall reflections but leaving it susceptible to floor and ceiling reflections that are indeed visible in the display. Some floor absorption was used near the microphone to limit the disturbance to the midrange response from the floor bounce. Except for this and some relatively thin carpet, the room is untreated. Delayed reflections from the back wall of the room are visible near the 38 ms. mark.

Figure 2 A 3-way speaker measured at 1m on axis in an untreated room
Because of the dominance of the speaker over the room modes, TDA correctly identify the direct response well down into the bass, although the direct response line does widen at lower frequencies. It’s easier to determine the frequency ranges affected by room modes and reflections by looking down on the 3D map from above. This is the TDA “pl” display option.
 Figure 3 The "TDA pl" display of the same measurement
It’s important to be able to distinguish between the properties of the speaker and properties of the room in these displays. To do that we must first understand the speakers; in particular, that they are corner speakers and rely on supportive reflections from nearby floor and walls to support the bass and to a lesser extent the lower midrange.
The wedge of red level response embracing the black vertical line of the direct response from 50 Hz up to 1000 Hz is the result of reflections from the floor at a nominal delay of 2.8 ms and from the ceiling as well where the delay is greater than 6.9 ms. For the corner woofer, this is floor support and does indeed seem to be propping up the direct response line in the 3D display. The crossover between the woofer and the multiple entry horn that sits on top of it is at 350 Hz and shows in the PL graph as an abrupt narrowing of the boundary support wedge. This narrowing continues gradually as frequency rises due to increasing directivity of the speaker and the increasing absorption from the carpet and temporary floor absorber used for this measurement. Unfortunately, what was boundary support for the woofer becomes boundary interference for the midrange resulting in nulls in the 400 -500 Hz range in unsmoothed measurements taken at the listening position.
Above the bass, we are seeing the speaker and not the room; that is abundantly clear in the 3D display. The color shading close in to the direct response line at higher frequencies is due to speaker imperfections and can be improved by minimum phase equalization. Strong room resonances appear as the red streaks at 50 and 70 Hz and a weaker one at 180 Hz. In a steady state, the standing waves of a room mode would develop but in a transient sine sweep or impulse response they can only be called resonances. The vertical white streak at 38 ms. has a timing consistent with a reflection from the back wall of the room.
The AFR is the un-normalized frequency response recorded along the black direct response line of the 3D display. Resonances, or their effects, can be seen in it. To wit, the resonances at 50 and 70 Hz result in a peak at 50 Hz followed by a shallow null at 70 Hz.

Figure 4 The AFR, the un-normalized frequency response graph of the direct response line of the 3D display
To the extent that the processing succeeds in separating the direct response from reflections, the effect of reflections won’t show up in the AFR. In this measurement, supportive floor reflections have elevated the bass and lower midrange but no reflection nulls are visible.
These 3 way speakers use active, DSP crossovers. They each consist of a multiple entry conical horn containing a compression driver tweeter and four 4” midranges sitting on top of a 15” sealed, slot loaded woofer nestled tightly into each of the room’s two front corners. Time alignment was achieved by setting DSP delays to align the IR peaks of individual drivers with their crossover filters and PEQs enabled. Time alignment was then confirmed with TDA. The delay bend just past the mid to CD crossover at 950 Hz is due to the mid-tweeter crossover; it increases with increasing crossover filter slope. A room resonance or reflection also affects the response there. The only hint in the 3D display of the woofer-mid crossover at 350 Hz is the narrowing of the floor support wedge there, indicating excellent time alignment. Both XOs use only 12 dB slope electrical filters, achieving 24 dB acoustical slopes. Neither crossover shows a phase wrap in its conventional frequency/phase response graph.

Figure 5 The Speaker Being Measured
[h=2](continued in next post)[/h]


