Hello all,
I've been extremely busy as of late, and that has resulted in several things around SFN falling by the wayside. I haven't been updating the "how to mix blog" and didn't finish the how to interpret measurement" thread. I also didn't really finish my thoughts on non "flat" tunings.
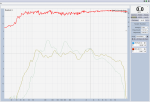
One that that was mentioned previously was asking for some before and after traces of some measurements in rooms. I recently had a client who doesn't care about having such things shared, and whose desired voicing I also enjoyed, so I thought I would post the measurements here. I don't have any time at the moment to elaborate on these plots, but hopefully they will stand alone for the time being, and be instructive for some. If you post questions about these plots, I eventually will respond, but it may be in 2012!
Please don't think that there is anything magical about this particular tuning curve. This is simply the result of measurements guiding the tuning for each zone, and then 45min of listening to various playback sources in the space and tweaking things by ear to mine and the clients' satisfaction. Also, for a volume reference, "loud" for this church is 90dBA slow, so the tuning was balanced with this playback level in mind.
Most of my (primarily church) tuning clients are either unsure about their integrator's prowess in system commissioning, or are unhappy with their current system optimization. I find that the period of listening with the client's relevant people in attendance is key to everyone's happiness. Sometimes that results in curves that deviate a great deal from what I would prefer, but in this case I felt the client and I were completely on the same page with the system voicing. The music director of this facility is an experienced studio engineer with a good ear, and I think that certainly that helped on our agreement.
Measurement details:
- This room is a church. We re-aimed and re-tuned their entire system with the new DSP they purchased.
- The PA is configured in 4 zones L+R, L, R, and L+R. So, stereo in the middle and mono on the extreme side wings.
- The measurements below are a 12 location, coherence weighted average of the R-R zone. That means the house right speakers on the house right side of the center church aisle. All other zones of the PA were muted for these measurements.
- The measurements were taking in SMAART 7.3.x using MTW for windowing and two second averaging.
- I've not included the phase measurements, as they have little meaning for these kinds of averages.
- Turquoise trace is the "before" measurements, and olive trace is the "after."
- Before trace has a 125Hz 4th order BW high pass engaged, so that explains the LF definciency. Subs are muted.
- After trace has a 2nd order Bessel high pass at 125Hz. Subs are muted.
- Room has all chairs, but no people, in it for these measurements.

Last edited:

