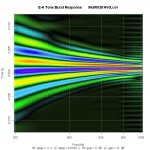
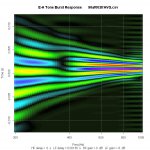
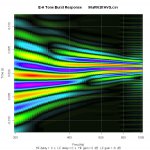
Time-frequency analysis lets us look at the same thing many different ways, and I've always been intrigued by getting to the same place by different paths, both literally, say when walking or driving, and metaphorically. Tone bursts seem like natural test signals as they resemble the musical waveforms we're interested in reproducing, and I've toyed with them in various ways in the past to represent linear system behavior. I have here a really simple representation that might serve as a "common sense" check for crossover networks, if not other things. It's like a time-frequency-energy representation with teeth (the oscillations of the tone burst itself).
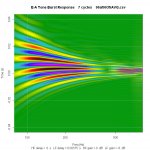
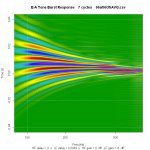
I take the impulse response of the system under consideration, which usually consists of an acoustic impulse response measurement processed with simulations of the proposed filters, and convolve it with a set of tone bursts of logarithmically spaced center frequencies and a fixed number of cycles. I then display the resulting time responses as a set of adjacent columns where color represents amplitude and each column corresponds to a particular frequency. It's as if we're viewing a set of adjacent oscilloscope traces from the top.
Below are 3 examples of the same crossover properly aligned, off by 1/2 cycle, and off by one full cycle at the crossover frequency of ~435 Hz. While in this case the correct alignment is pretty obvious from the phase traces, which are well behaved, this might be a useful check on messier (sub) alignments where we want to be sure we're not off by an entire cycle, or could do better by flipping polarity.
I'm using a raised cosine (von Hann) window to form the tone bursts although I doubt it's critical. Since a tone burst is the product of a sine wave and a window its spectrum is the convolution of an impulse (at the positive and negative sine wave frequencies) and the Fourier transform of the window, so just the shifted spectrum of the window. Since the spectrum is narrow and the window's sidebands are way down, the tone burst tends to suppress aliasing in the frequency domain. This is of little consequence when the measured signal is band limited to begin with, as it usually is, but is a useful property when looking at the tone burst response of high-pass systems alone, as when looking at how a particular filter behaves with an ideal speaker.
As an aside, a few weeks ago I spent some time feeding (rectangular) tone bursts from signal generator into a sound system and looking at the response with a mic connected to a scope. It's an instructive thing to do although the tick-tick-tick, dunk-dunk-dunk will drive you nuts after a while. Try it sometime.
Best,
--Frank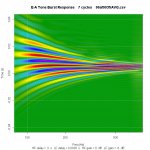


